1 Like
20 Views
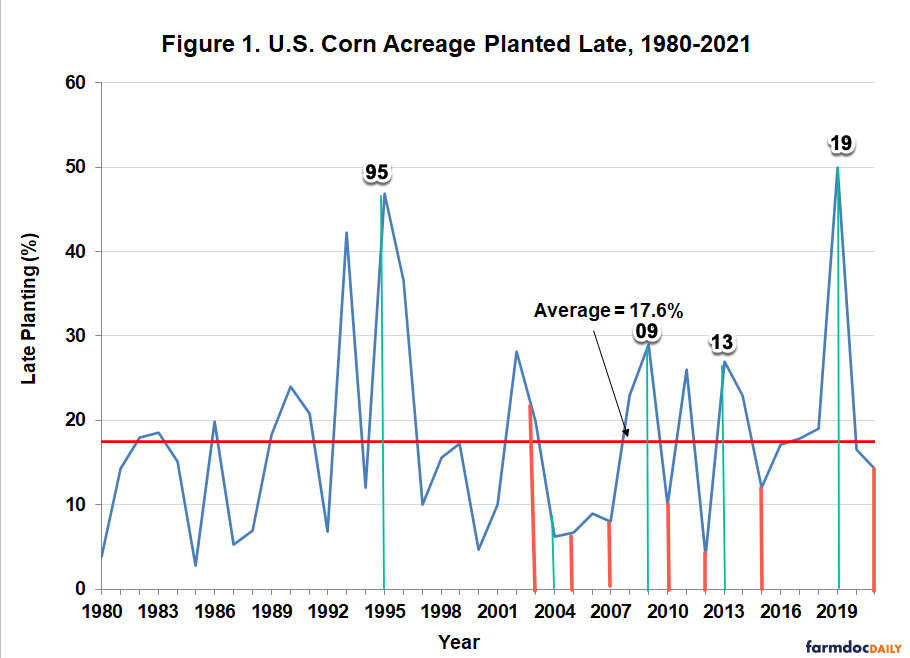
After I sent out yesterday’s Buzz, which was focused on some possible late planting concerns and historical downstream impacts on grain drying, I pulled out some old data I had from years back as it relates to grain drying demand, and then I overlaid some data from the web. Here is the image, and I will explain below:

The original chart showed the years when corn was planted late, and the horizontal red line is at the 18% line, so anything over that line is a higher percentage of the corn planted when it is considered ‘late’.
I added vertical green and red lines. The green lines indicated years where there was solid to great grain drying, the red lines were years where grain drying was not that great…and it’s interesting to see the red years mostly line up with years where smaller percentages of the overall crop were planted on time or early. The green years match up with years where higher percentages of the overall crop were planted late; 1995, 2009, 2013 and 2019.
This is why the timing of the plant is always the first thing we note every year when trying to analyze potential grain drying needs. As I wrote yesterday, the timing of the plant doesn’t guarantee anything, but when the corn is planted ‘on time’, the data seems pretty clear: the prospects for Corn Belt-wide grain drying demand are much lower than when a higher percentage of the overall crop is planted ‘late’.
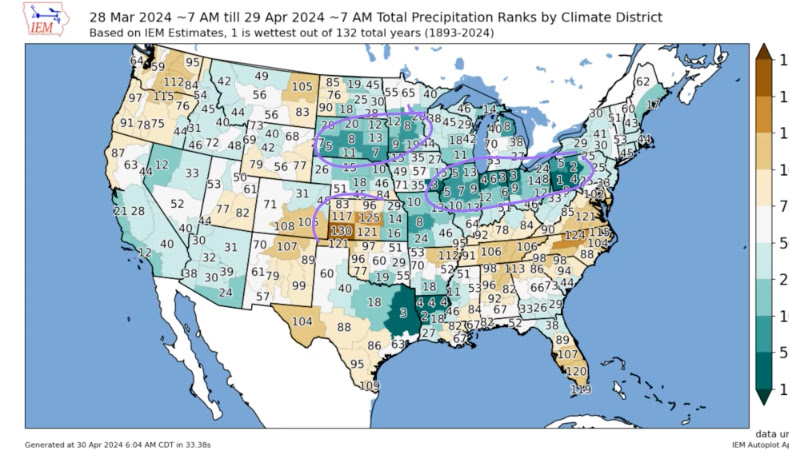
This next image shows historical year-over-year comparisons of precipitation for the period of March 28 through April 29. You can see from SE Iowa all the way eastward into Pennsylvania, we have seen very wet conditions. Any number below 66 means it has been wetter than the 132-year average. Today’s video from BAM discusses potential planting windows, and it seems like such windows may be few and far between over the next couple of weeks…which could push us into the ‘late planting’ period.

